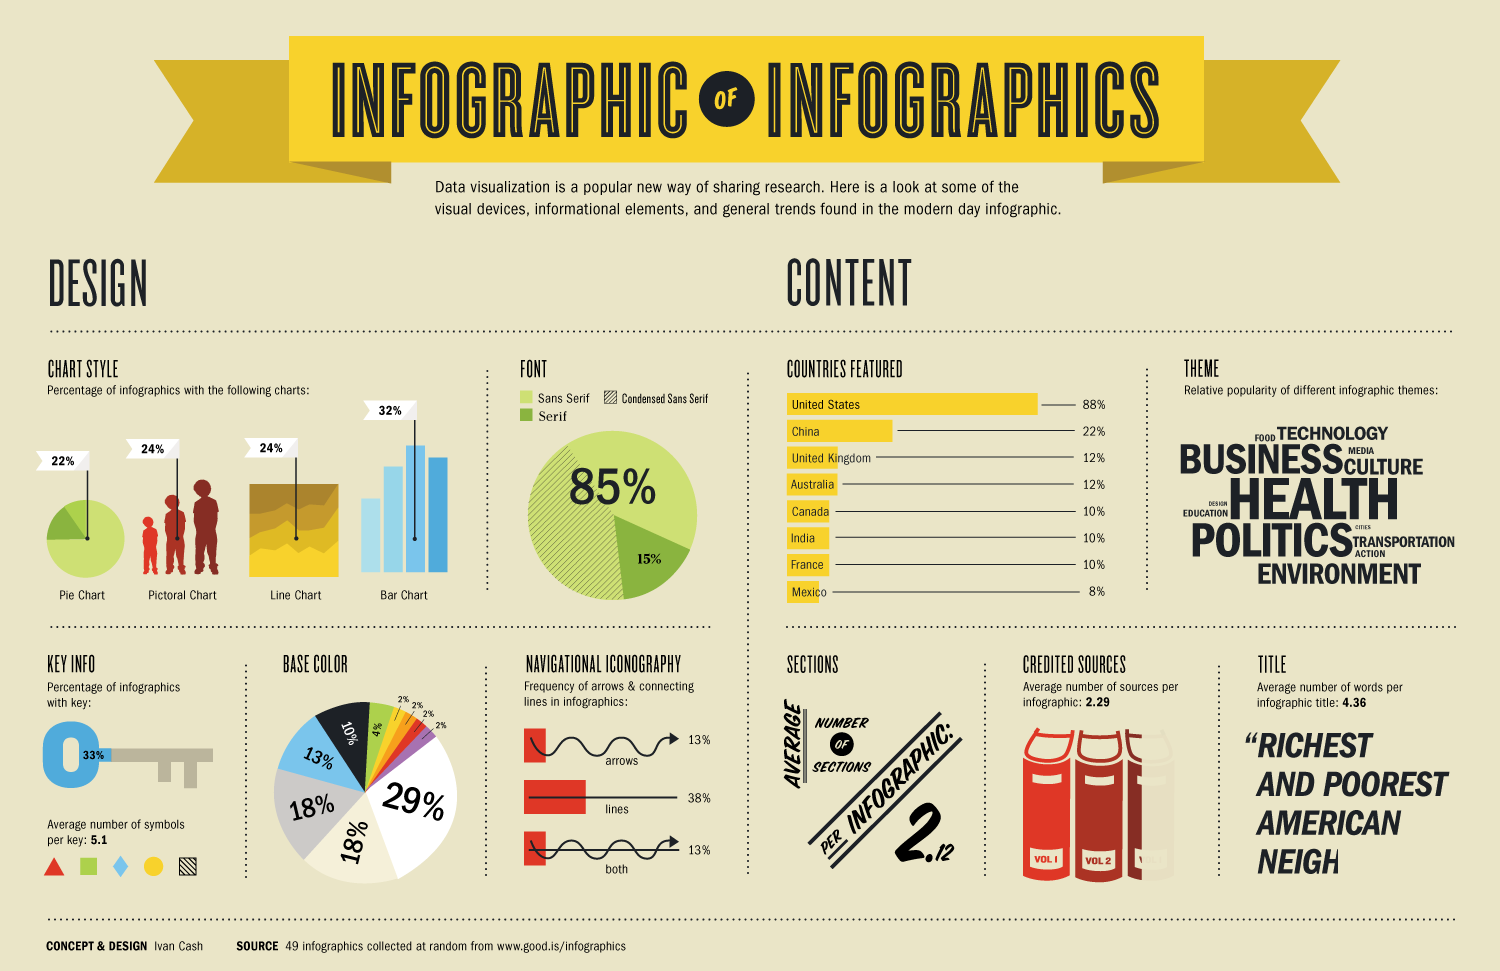
Information graphics or simply Infographics are used to represent information, statistical data, or knowledge in a graphical manner, it is usually represented through all sorts of possible visuals to easily send a message and to attract the viewer's attention. Infographics summarizes complex data and helps make it become visually appealing to keep the viewers interested.
A few examples of Infographics are:
- Canva Infographic Maker.
- Vizualize.
- Google Charts.
- Easel.ly.
- Piktochart.
- Infogr.am.
- Photo Infographic Gen Lite.
- Venngage.
Let's get started.
Using one of the tools mentioned above, let's try Creating Inforgraphics with Piktochart. Here are the following steps in order to do so:
- Create a Piktochart account by going to https://piktochart.com/, click on Sign Up on the upper right corner of the page.
- Fill up the required information on the Sign Up page; alternatively, you can connect with your Google+ or Facebook account.
- Once you have created an account and logged in, select a template and you're all set to make your own Infographics! In case of confusion, click on the "Full Tour" button, it'll serve as your guide for an in-depth explanation regarding every function in the program.
Editing Tips:
- Double-click a text to edit the content.
- When working with objects, the toolbox on top of the topmost block will allow you to manipulate with the contents.
- When working with charts, double-click the chart to open the datasheet editor.
- You may rename the title of your inforgraphic on the top of the toolbar.
Infographics are quite useful, master its capabilities and you'll be able to be one of the most visited sources!
Thanks for reading, and have a nice day.
This comment has been removed by the author.
ReplyDelete